There’s an old quote by a man John Wanamaker you’ve probably heard of: “Half the money I spend on advertising is wasted. The trouble is, I don't know which half.”
This adage is over a century old. However, its grip on businesses can be felt even today. Many clients that we’ve spoken with have had mixed feelings about their investments in marketing because they feel they can’t properly measure its success.
That should never be true. You should — and can — measure the impact and ROI of every top-of-funnel (TOFU) marketing dollar you spend. In this blog, we’ll get back to the basics and take you through each step of that process:
- tracking leads you generate
- determining how well each campaign is converting leads
- attributing revenue back to each channel
Tracking Lead Generation
The bedrock of measuring any TOFU marketing is tracking the number of leads you generate. There are actually two parts to this.
The first is having some defined process of recording contact information for every new person who enters the funnel. Most businesses do this in a Customer Relationship Management (CRM) system such as Salesforce, Pipedrive, or HubSpot. Record everything you know — their name, email address, date they became a lead, phone number, company name, address, company domain, etc.
The second part to tracking your lead generation is tagging every contact with their lead source. Where did they come from? How did they find you — or you find them? This is non-negotiable, as it will be the basis later for accurately measuring which of your marketing efforts were most effective at generating the most leads and the most valuable deals.
Examples of lead sources include:
- Google AdWords
- Organic Search
- Trade Shows
- Referrals
- Webinars
Measuring TOFU Conversion Rates
At the same time as you’re tracking every lead you generate, you need to understand where you’re over- or under-performing. Measuring conversion rates (the percentage of people who complete a desired action, compared to the number of people that action was presented to) is how you do that.
Let’s say your sales funnel is a bit dry and you increase your Google AdWords budget for a month. Your goal is to send more users to a landing page where they can download a white paper. From this, you get 50 downloads. Compared to the last month, that sounds great! But, then you look and see that 4,950 people got to that landing page and left without doing anything.
Out of nearly 5,000 visits, only 50 people filled out the form — a 1% conversion rate.
Imagine if you took a day to optimize the landing page; tweaking the copy, changing the imagery, or increasing visibility on the form by moving it above the fold. If that bumped your conversion rate to just 5%, that’s 200 additional leads.
Calculate your conversion rates for each landing page, form, or TOFU marketing campaign and compare them to benchmarks to discover low-hanging fruit for valuable optimization. Here are a few conversion rate benchmarks to get you started:
- Landing Pages (All): 4.02%
- Facebook Ads: 9.21%
- Google Ads: 3.75%
- LinkedIn Ads: 6.1%
- Display Ads: 0.77%
- Pop-Up Forms: 3.09%
Calculating ROI
Now that you’ve been tracking all the leads you’re generating and optimizing your marketing assets for conversion, you’re set to attribute revenue back to each campaign.
Let’s say you want to measure your TOFU marketing from Q1. You know that your team:
- Attended two trade shows, with booths at each
- Put additional budget into Google AdWords
- Hired an SEO consultant to support improvements in your organic search rankings; they’ve been optimizing your site while producing new content
- Co-hosted a webinar with a vendor, promoting it through paid social media ads
Take the leads generated from January–March and sort them by lead source. Then, filter for only those contacts with closed deals. Let’s say that at this stage in the process, your numbers look like this:
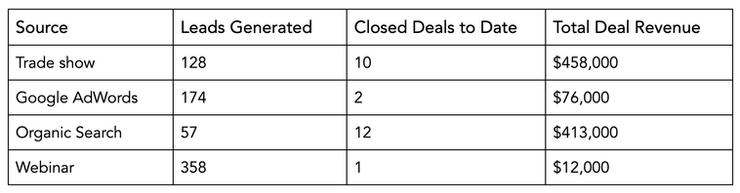
Step 1: Measuring Lead-to-Deal Conversion Rates
While you can already see the surface-level effectiveness of your TOFU marketing by looking at the Leads Generated, it’s important to look at how many of those leads turn into deals.
In the above example, only 2 of the 174 leads generated by Google AdWords became deals. That’s just above a 1% conversion rate — not great. It could be that your ads aren’t finding the right people. However, it could also be true that your middle- and bottom-of-funnel nurturing isn’t set up properly for the leads that come in through AdWords.
Step 2: Calculating ROI
The next step is simple. Take the trade shows as an example. Together, you spent:
- $40,000 on the booths
- $12,000 on travel and hotels
- $10,000 on a sponsorship
- $3,500 on marketing materials
In that case, your gain is $392,500 ($458,000 deal revenue - $65,500 cost) and your percentage ROI is 599%. For every dollar you spent on a trade show, you saw around $6 in revenue — pretty solid!
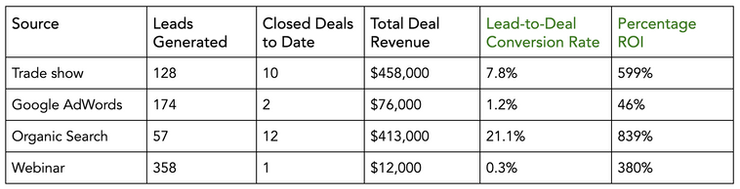
Given you went through this same cost-analysis calculation for each lead source, here’s an updated version of what your chart could look like with the addition of Lead-to-Deal Conversion Rates and Percentage ROI.