
You’ve probably seen article after article of experts claiming they know the best, most important, and most useful marketing key performance indicators (KPIs) you need to monitor. But the truth is, the most important B2B marketing KPIs you need to track all depend on your team’s goals. Are you trying to expand brand awareness? Grow your conversions? Maybe all the above?
While we could help you pinpoint the marketing KPIs that will help you reach your goals during a 1-1 conversation, we decided to put together a list of the top 5 we recommend you consider monitoring for success in all areas of marketing. Let’s get into it.
1. Traffic-to-Lead Ratio
The traffic-to-lead ratio depicts the percentage of website visitors who turn into actual leads. Ultimately, monitoring your traffic-to-lead ratio on a consistent basis will help you figure out which pages work well to convert leads and which pages may be in need of improvement.
By leveraging this KPI, you can uncover potential reasons why your site is getting a lot of organic traffic and yet, visitors are not converting into leads. Is it possible that there is a misalignment between the CTA they click on to get to your site versus what is actually on your site? Or maybe the content on your site lacked information or relevance.
To determine your traffic-to-lead ratio, follow this example. Let’s say that the number of website visitors you have in a given month is 1,000. In the same month, 100 of these visitors became leads.
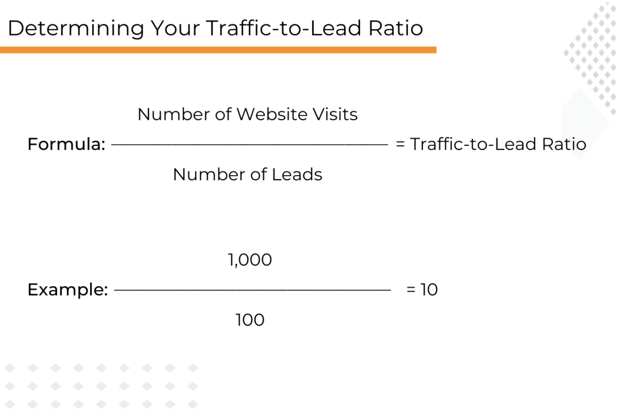
By dividing the number of website visits by the number of leads garnered in the month, we determined that the traffic-to-lead ratio of this example is 10:1 or 10%. That means for every 10 website visitors, 1 of them will convert into a lead. Experts report that a great traffic-to-lead ratio is at or above 2-4%. If your ratio is less than 2%, you may need to improve the copy on your site or the site overall.
2. Lead-to-Close Conversion Ratio
The lead-to-close conversion ratio is the percentage of leads that become your customers. This B2B marketing KPI is critical to prioritizing your marketing initiatives. Ask yourself this, which campaigns convert the most leads into customers? Likewise, which campaigns convert the least amount of leads into customers? With the lead-to-close conversion ratio, you can uncover these valuable insights.
Consider this example. In a given quarter, the total number of marketing-influenced closed won deals your team made was 80. Yet, the number of leads generated in the same quarter was 500. To determine the lead-to-close conversion ratio, follow this formula:
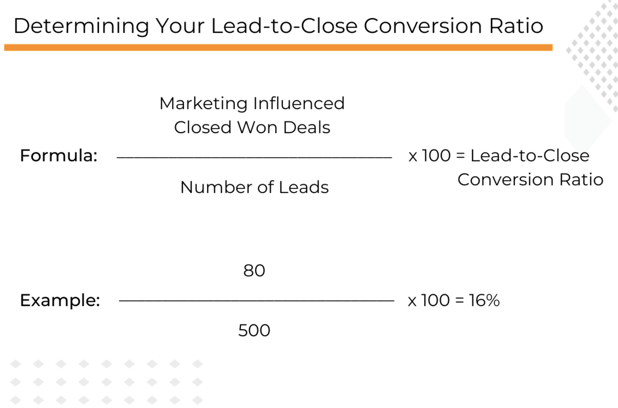
In this example, the lead-to-close ratio is 16%. That means that for approximately every 500 leads, 80 of them are likely to make a purchase. Experts proclaim the average lead-to-close ratio is around 20%. But we know that the ideal ratio fluctuates depending on your industry.
According to HubSpot, the lead-to-close ratios for various B2B industries are as follows:
- Biotechnology Industry: 15%
- Computer Software Industry: 22%
- Finance Industry: 19%
Understanding this marketing KPI helps you determine the value of your leads. Are you bringing in hundreds of leads, but only a dozen are making purchases? If so, it might be time to rethink your marketing strategy.
3. Customer Acquisition Cost
One of the most important B2B marketing KPIs is customer acquisition cost (CAC). Essentially, the CAC tells you how expensive a single customer is to acquire. This KPI is so crucial to marketing success because if it costs you more to acquire customers than the value they bring to your business, you’re not generating any revenue.
For example, say you’re spending $5,000 each month on your entire marketing costs, including (but not limited to) employee wages and your tech stack. And in the same month, you acquire 100 new customers. By using the formula below, you can determine how much it costs, on average, to acquire each of these 100 customers.
Pro Tip: For this KPI, the lower the number, the better.
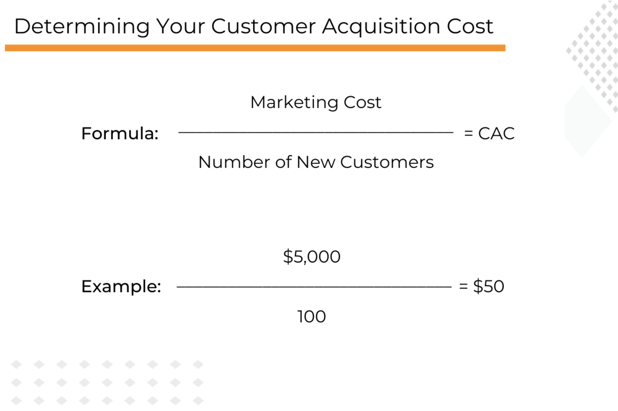
As shown above, the CAC in this example is $50. By monitoring this marketing KPI, you can make data-driven marketing decisions to lower this number. For example, determine where in your marketing budget you may be spending a little extra money on something that doesn’t bring in a positive ROI. Can this money be reallocated into something that will make a greater impact?
4. Customer Lifetime Value (CLV)
The customer lifetime value (CLV) marketing KPI defines how much revenue each customer brings to your business over the span of the time they remain your customer. This KPI helps you understand which customers bring in the most revenue over time. With this insight, you can prioritize these customers and focus on upselling them. Additionally, if you have a customer with a lower CLV, you can try to increase their CLV through nurturing campaigns. Let’s take a look at an example.
Let’s say the annual revenue from a specific customer is $200,000. Plus, they have been loyal for 3 years. To calculate their CLV, use the formula in the graphic below. For this formula, you will also need to know your CAC. For the sake of this example, let’s say your CAC is $100.
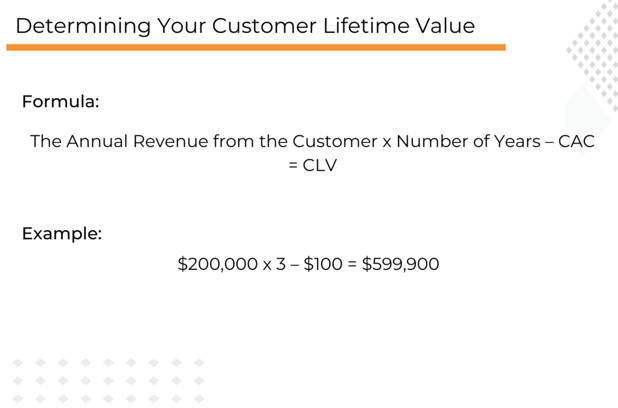
In this example, the CLV is $599,900. Now, you can compare your other customer’s CLV and determine who your top customers are. Additionally, you can determine who your least valuable customers are and develop a plan to increase their CLV by upselling other products or services.
5. Return on Marketing Investment
According to Oracle, the return on marketing investment is what marketing teams use “to justify how marketing programs and campaigns generate revenue for the business.” Often, marketers spend too much budget on one aspect of marketing when the data (and finances) show that they should spend more on a different marketing channel. Wouldn’t you want to know if your direct mailing efforts are less lucrative than your email marketing campaigns? Yeah, we thought so.
Let’s take a look at an example of how to leverage the following formula to determine your return on marketing investment. First, you’ll need to subtract the cost of marketing from your overall revenue. Then, you’ll divide this number by the marketing cost to get your ROI percentage.
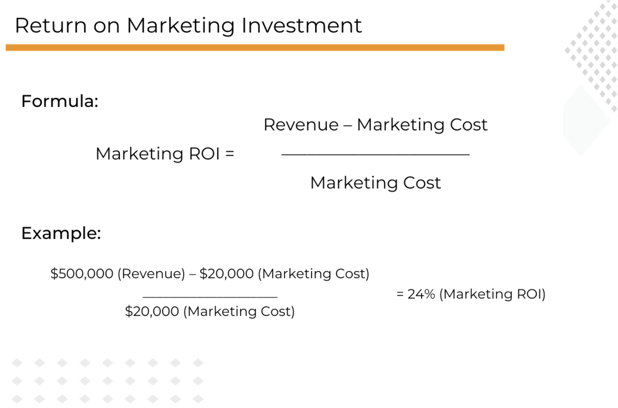
So if your revenue was $500,000 and the overall cost of your marketing spend was $20,000, your marketing ROI is 24%.
For further reference, Oracle also states, “An efficient marketing campaign may result in a cost ratio of 5:1—that is, $5 generated for every $1 spent, with a simple marketing ROI of 400%. An excellent campaign might see a cost ratio of $10 generated for every dollar spent (10:1) with a simple marketing ROI of 900%.”